Data Challenge 2020

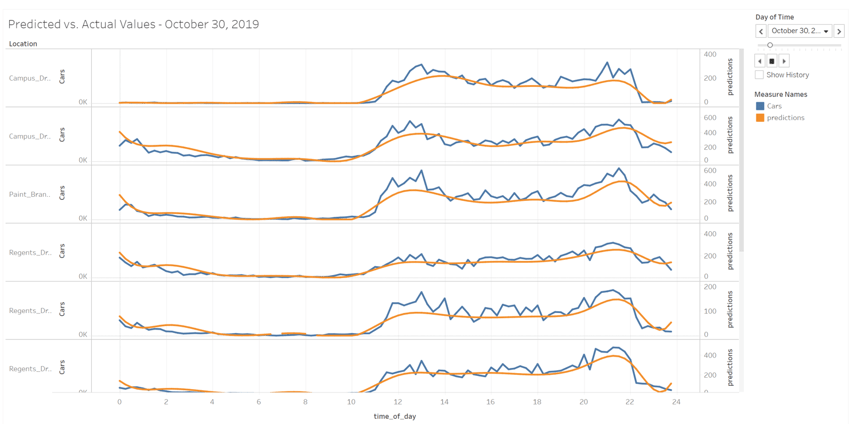
DOTS Campus Traffic Counts - Data Visuals

Home

Problem Overview

Approaches

Data Visuals

Findings

Image depicting all traffic volumes by hour; excluding times from 11PM-10AM
Image depicting all traffic volumes over two weeks average by 15-minute intervals and hour; 
        excluding times from 11PM-10AM
Image depicting traffic volume by sensor location and minute
Image depicting traffic volume by sensor location and hour
Image depicting traffic comparisons based on a Saturday football gameday, and a Saturday with no football game